Microspectrometers, also called compact spectrometers or miniature spectrometers and their applications is the subject of this blog article.
This article is brought to you by Ocean Optics - a leading developer and manufacturer of cutting-edge spectroscopy solutions and components.
Introduction to Microspectrometers
Spectroscopy has long been a cornerstone of modern science and technology, enabling researchers to analyze light and matter interactions across physics, chemistry, biology, medicine, and materials science. Traditionally, spectrometers were bulky, benchtop instruments that required dedicated lab space and controlled conditions. Today, a new class of devices – microspectrometers, also known as compact spectrometers or miniature spectrometers, has revolutionized this field.
Manufacturers such as Ocean Optics, Ibsen Photonics, Hamamatsu, Avantes, Zolix among others have pioneered the design of portable, high-performance instruments that fit in the palm of your hand. Despite their small size, microspectrometers deliver reliable, accurate data and have opened spectroscopy to countless new applications outside of traditional laboratory settings.
This article explores the principles, benefits, and applications of microspectrometers, showing why these compact devices are transforming optical sensing and measurement.
What Are Microspectrometers?
A microspectrometer is a compact optical instrument that measures the intensity of light over a specific spectral range. Like traditional spectrometers, they work by dispersing light into its constituent wavelengths and detecting the resulting spectrum. The key difference lies in miniaturization.
By using advanced diffraction gratings, CMOS/CCD detectors, and fiber-optic coupling, engineers have shrunk spectrometer designs to match modern demands for portability and integration. Some microspectrometers are no larger than a matchbox, yet they can achieve spectral resolutions on par with benchtop systems.
Core Optical Architectures
Most microspectrometers follow one of three optical layouts:
Czerny–Turner (CT): Uses separate mirrors to collimate and focus light with a reflective grating in between. This classic design is flexible and common in compact modules from Ocean Optics and others.
Transmission-grating spectrometers: Ibsen Photonics popularized compact CT-like layouts that use high-efficiency transmission gratings, enabling short optical paths, low stray light, and industrial robustness.
MEMS/on-chip spectrometers: Hamamatsu and others integrate grating and detector into a tiny package using MEMS or planar waveguide technology. These parts are extremely small, low-power, and easy to embed.
Each architecture trades off throughput, size, stray light, and manufacturability. Transmission gratings often deliver high efficiency and compact packaging. Classic CT designs can be easier to customize. MEMS devices win on size and power, with some limits on resolution and spectral range.
Key Components and Their Roles
Entrance slit: Defines the optical resolution and sets how much light enters. Narrow slits improve resolution at the cost of signal; wider slits do the opposite.
Fiber/connector: Many compact spectrometers accept SMA-905 or FC/PC fiber inputs for modular sampling. Fiber choice (core size, NA) directly affects throughput and spot size at the slit.
Dispersive element: Ruled or holographic gratings (reflective or transmissive) set the central wavelength, efficiency, and stray-light behavior.
Focusing optics: Lenses or mirrors image dispersed light onto the detector.
Detector array: Linear CCD or CMOS arrays from a few hundred to a few thousand pixels. Key metrics include pixel size, quantum efficiency (QE), read noise, and dark current.
Electronics and firmware: Provide A/D conversion, temperature sensing, triggering, and interfaces like USB, Ethernet, SPI, or I²C.
Software: Handles wavelength calibration, dark/white referencing, baseline correction, filtering, and analytics such as colorimetry or chemometrics.
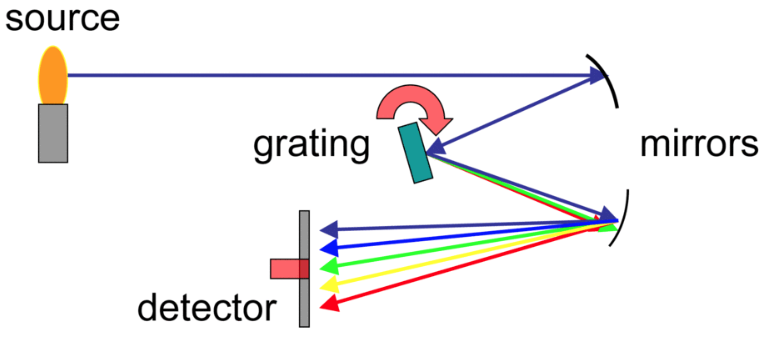
Schematic of a spectrometer measuring the spectrum of light (Courtesy of WikiMedia Commons)
Performance Specifications That Matter
When you compare compact spectrometers, look beyond the headline wavelength range and consider the following metrics:
Spectral range and resolution: Typical UV–Vis ranges span 200–850 nm; Vis–NIR 350–1100 nm; Modules based on InGaAs cameras extend to 1700–2500 nm. Resolution (FWHM) depends on slit width, grating groove density, optical path, and pixel pitch. Be sure you understand whether the quoted resolution is with a standard slit or a best-case configuration.
Sampling interval vs. resolution: Pixel-to-wavelength mapping yields a sampling interval (nm/pixel). For accurate line shapes, you want at least 2–3 pixels across the instrument function.
Throughput/SNR: Throughput is governed by f/#, slit, grating efficiency, and detector QE. Signal-to-noise ratio scales with integration time and averaging; shot noise, read noise, and dark current set the floor.
Stray light: Unwanted light from scattering and higher orders limits dynamic range, especially in UV work or when measuring sharp absorption features. Transmission gratings and good baffling help.
Dynamic range and linearity: Important for reflectance and transmittance measurements over bright and dark regions.
Wavelength accuracy and thermal drift: Compact spectrometers can drift with temperature. Some include thermoelectric (TEC) control) or internal references to maintain stability.
Triggering and synchronization: External trigger I/O and TTL sync enable time-resolved measurements, pulsed sources, or line-scan integration on moving parts.
Advantages of Microspectrometers
Portability: Handheld or battery-powered deployments for field work, QA at the loading dock, or drone-mounted scans.
Cost efficiency: Lower instrument cost expands spectroscopy to classrooms, startups, and distributed sensors.
Integration: Small modules bolt into instruments such as colorimeters, fluorimeters, Raman probes, and OEM process heads.
Speed: Millisecond acquisitions support closed-loop control and high-throughput screening.
Scalability: Multichannel arrays of compact spectrometers can cover wide spectral ranges or multiple sampling points in parallel.
Ecosystem: A mature accessory ecosystem—light sources, probes, cuvette holders, integrating spheres, cosine correctors—speeds solution development.
Limitations of Microspectrometers and How to Mitigate Them
Lower optical throughput: Smaller optics and narrower slits collect less light. Mitigate with brighter sources, larger-core fibers, or longer integration with averaging.
Resolution ceilings: Benchtop echelle or long-focal-length CT systems still outperform on highest resolution. Choose gratings wisely and consider order-sorting filters.
Temperature sensitivity: Use TEC-stabilized detectors or mount modules to heat-sinking masses; enable software temperature correction when available.
Stray light in the UV: Favor holographic or transmission gratings; add order-sorting filters and blackened baffles.
Calibration drift: Schedule wavelength checks using low-pressure lamps (Hg/Ar, Ne), and intensity calibration using NIST-traceable lamp standards or calibrated LEDs.
Practical Buying and Integration Checklist
Define the job: Absorbance, reflectance, emission, color, irradiance, or fluorescence? Each drives spectral range and dynamic range requirements.
Pick the range: UV–Vis (200–850 nm) for color and biochemical assays; Vis–NIR (350–1100 nm) for color and materials; SWIR (900–1700/2500 nm) for moisture, lipids, and plastics ID.
Resolution target: Match FWHM to the features of interest—e.g., 0.5–1.5 nm for sharp gas lines; 2–5 nm for broad color or reflectance work.
Throughput plan: Balance slit width and fiber core with available light; consider integrating spheres for reflectance and cosine correctors for irradiance.
Detectors: Silicon arrays for UV–NIR to ~1100 nm; InGaAs for SWIR. Check QE curves at your wavelengths.
Interface & power: USB-powered is simplest; Ethernet enables remote deployments; embedded SPI/I²C is ideal for OEMs.
Mechanical & environment: Shock/vibration, temperature range, and IP rating matter for field gear.
Software toolchain: SDKs, drivers, scripting hooks (Python/Matlab/LabVIEW), and built-in analytics (colorimetry, chemometrics).
Representative Product Families (Examples)
Ocean Optics: USB-connected UV–Vis and NIR compact spectrometers with configurable slits and gratings; strong accessory catalog for light sources and sample handling.
Ibsen Photonics FREEDOM/ROCK: Transmission-grating spectrometers engineered for low stray light, industrial ruggedness, and small footprints suitable for OEM integration.
Hamamatsu micro-spectrometers: MEMS/on-chip devices like ultra-mini modules that balance tiny size with usable resolution for embedded sensing.
Avantes AvaSpec: Modular compact spectrometers with TEC options, multi-channel synchronization, and broad wavelength coverage.
(Brand names above serve as representative examples; consult current datasheets when specifying a model.)
Applications of Microspectrometers
Field-Ready Environmental Sensing. Portable UV–Vis spectrometers quantify nitrate, chemical oxygen demand (COD), and pigment signatures in natural waters. With waterproof fiber probes and cosine correctors, teams can measure irradiance, water color, and algal blooms on site. Battery-powered modules log spectra to rugged tablets, enabling real-time decisions instead of waiting for lab results.
Food, Agriculture, and Aquaculture. In precision agriculture, Vis–NIR spectroscopy estimates crop nitrogen status and moisture content from leaf reflectance. SWIR-capable microspectrometers help evaluate grain protein, fruit ripeness, and fat content in meat or fish. On the factory floor, inline reflectance checks verify roast color of coffee, flour ash content, or the uniformity of chocolate glaze.
Biophotonics and Point-of-Care Testing. Compact spectrometers underpin portable absorbance and fluorescence readers for biomarkers, enzyme kinetics, and DNA quantification. Battery-operated cuvette readers or microfluidic cartridges paired with miniature spectrometers deliver quantitative results in clinics and field hospitals. Narrow-band excitation sources and time-gated detection improve specificity and SNR.
Industrial Process Monitoring. Microspectrometers sit inside process heads to track color, concentration, and impurity levels in chemicals, paints, polymers, and pharmaceuticals. With external triggering and sub-100 ms acquisition, they close control loops on mixers, coaters, and extruders. Fiber-optic sampling allows measurements in harsh or high-temperature zones while keeping the spectrometer safe.
LED, Laser, and Display Metrology. From LED binning to laser safety checks, compact spectrometers measure peak wavelength, FWHM, flicker-free irradiance, CCT/CRI, and radiance. Integrating spheres and calibrated halogen or deuterium-tungsten light sources enable traceable radiometry. For Raman and fluorescence, fiber-coupled microspectrometers capture emission spectra with interchangeable filters and notch/reject optics.
Recycling, Plastics ID, and Security. SWIR microspectrometers enable hyperspectral sorting of polymers on conveyor belts, while UV–Vis units detect counterfeits via security-ink signatures. Portable kits help customs and law enforcement screen unknowns on site without sending samples to central labs.
The Road Ahead
Three trends will shape the next generation of compact spectrometers:
Greater integration: on-chip gratings and detectors with micro-optics reduce size and cost while improving robustness.
Computational spectroscopy: machine learning and model-based deconvolution will extract more information from lower-SNR data, enabling even smaller optics without sacrificing accuracy.
Connected sensing: cloud-enabled devices will correlate spectra with context (GPS, temperature, images), building large labeled datasets that improve calibrations over time and enable predictive maintenance.
Together these advances move spectroscopy from a specialized lab tool to a ubiquitous sensing modality embedded in products, vehicles, and infrastructure.
Conclusion
Microspectrometers compress the power of optical spectroscopy into modules small enough for pockets and production lines. With thoughtful selection of wavelength range, resolution, throughput, and software ecosystem – and with good measurement hygiene – compact spectrometers deliver lab-grade insights where and when they matter. Whether you are validating water quality in the field, controlling a coating line, or building a handheld medical analyzer, today’s compact spectrometers from Ocean Optics, Ibsen Photonics, OZ Optics, Zolix, Avantes, and others make spectroscopy accessible wherever decisions are made.
Literature and Further Reading
Ocean Optics. Compact Spectrometers and Applications Guides.
Ibsen Photonics. FREEDOM and ROCK OEM Spectrometer Series Technical Notes.
Hamamatsu Photonics. Micro-spectrometer Module Application Notes.
Avantes. AvaSpec Series Datasheets and Application Guides.
P. R. Griffiths & J. A. de Haseth, Fourier Transform Infrared Spectrometry, Wiley.
E. Smith & G. Dent, Modern Raman Spectroscopy: A Practical Approach, Wiley.
J. M. Hollas, Modern Spectroscopy, Wiley.