Laser speckle surface metrology is the subject of this blog article. This is an introductory material and will be continued in more depth is following articles.
Laser speckle is often treated as an unwanted artifact in optical systems, something to be minimized through spatial averaging, coherence reduction, or post-processing. However, in surface metrology, speckle is not noise to be eliminated but a rich source of information. Laser speckle imaging has emerged as a powerful, non-contact technique for characterizing surface roughness, deformation, vibration, and dynamic behavior across a wide range of materials.
Unlike interferometric methods that require precise optical alignment and smooth surfaces, laser speckle-based metrology is robust, scalable, and tolerant of real-world conditions. These characteristics have driven its adoption in manufacturing, materials science, biomechanics, and process monitoring, where traditional metrology tools struggle.
This article focuses on how laser speckle imaging is used for surface metrology, building on prior discussions of speckle formation while emphasizing practical measurement techniques and applications.
This article is brought to you by Connet Laser Technology Co., Ltd. - a leading manufacturer of semiconductor and fiber lasers.
From Optical Artifact to Measurement Signal
When coherent laser light illuminates a rough or scattering surface, the reflected wavefronts interfere to form a granular intensity pattern known as a speckle pattern. While the statistical properties of speckle are well understood, the key insight for metrology is that speckle patterns are highly sensitive to changes in surface geometry and motion.
Even sub-micron displacements, slight tilts, or local deformations cause measurable changes in the speckle field. By tracking these changes over time or space, laser speckle imaging transforms random-looking intensity patterns into quantitative surface information.
This approach differs fundamentally from traditional imaging or interferometry. Instead of measuring absolute phase or height directly, speckle-based methods extract relative changes with high sensitivity and minimal system complexity.
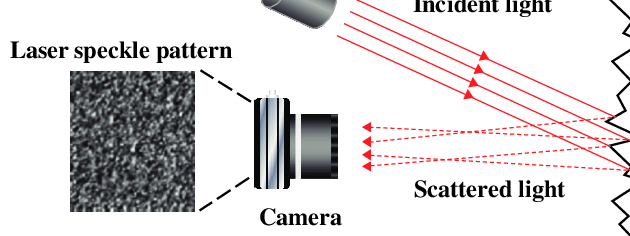
Courtesy of ResearchGate
Core Laser Speckle Surface Metrology Techniques
Several speckle-based methods are commonly used for surface metrology, each targeting different physical parameters.
Speckle Contrast Analysis
Speckle contrast quantifies the intensity variation within a local region of the image. It is defined as the ratio of the standard deviation to the mean intensity over a specified area or time window.
In surface metrology, speckle contrast provides insight into:
surface roughness and scattering behavior
micro-motion and vibration
dynamic changes in surface structure
Higher roughness generally produces stronger scattering and more fully developed speckle, while smoother surfaces yield reduced contrast under comparable conditions.
Speckle Correlation and Decorrelation
By correlating speckle patterns acquired at different times or under different loading conditions, it is possible to measure:
in-plane displacement
out-of-plane deformation
strain fields
surface creep and relaxation
Speckle decorrelation occurs when the surface changes enough to alter the phase relationships of scattered light. The rate and spatial distribution of decorrelation encode information about deformation and motion.
Digital Image Correlation Using Speckle
In laser speckle digital image correlation (DIC), the natural speckle pattern serves as a high-contrast, self-generated texture. This eliminates the need for artificial surface markers or painted patterns. Speckle-based DIC is particularly useful for: high-temperature environments, delicate or biological samples, surfaces where applying markers is impractical.
Surface Roughness Measurement Using Speckle
Surface roughness plays a critical role in optics, tribology, adhesion, and coating performance. Traditional profilometers and atomic force microscopes provide high resolution but are limited in speed, area coverage, and environmental robustness.
Laser speckle methods offer a complementary approach. Statistical properties of the speckle pattern, such as contrast, spatial frequency content, and angular distribution, are linked to surface roughness parameters including RMS height and correlation length.
Key advantages include:
non-contact operation
large-area inspection
suitability for inline monitoring
tolerance to vibration and dust
Speckle-based roughness measurement is especially valuable in applications like metal finishing, additive manufacturing, and rolled materials, where surfaces are too rough or large for conventional optical profilometry.
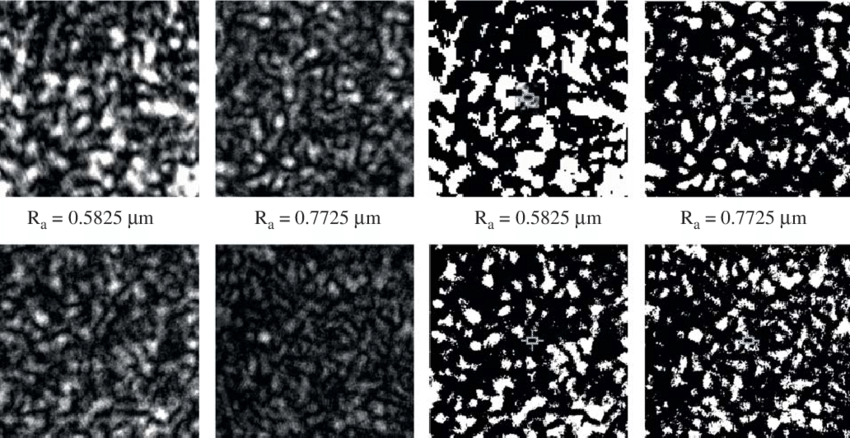
Courtesy of ResearchGate
Measuring Deformation and Strain
One of the most powerful applications of laser speckle imaging is deformation measurement. When a surface is subjected to mechanical stress, thermal expansion, or pressure, the resulting micro-scale motion alters the speckle pattern.
By comparing speckle images before and after loading, engineers can map:
displacement vectors
strain distributions
crack initiation zones
fatigue-induced changes
Unlike interferometric techniques, speckle-based deformation measurement does not require nanometer-scale surface smoothness or vibration isolation. This makes it well suited for industrial environments and field testing.
Vibration and Dynamic Surface Motion
Laser speckle imaging is highly sensitive to dynamic motion. Even small-amplitude vibrations can cause rapid speckle decorrelation, enabling the detection of:
mechanical resonance
structural instability
tool chatter
rotating machinery faults
Time-resolved speckle analysis allows vibration frequencies and amplitudes to be extracted without physical contact. This capability is particularly useful for monitoring fragile components, MEMS devices, and high-speed manufacturing equipment.
Flow and Shear at Surfaces
Although commonly associated with biomedical imaging, laser speckle techniques are also applied to surface-adjacent flow measurement. When a flowing medium interacts with a surface, speckle fluctuations reflect local velocity and shear conditions.
Industrial examples include:
coating flow uniformity
lubricant behavior on mechanical surfaces
polymer melt dynamics
fluid-solid interaction studies
These measurements provide insights that are difficult to obtain with particle-based velocimetry or embedded sensors.
System Components for Speckle-Based Metrology
A typical laser speckle metrology system consists of relatively simple hardware compared to interferometric setups.
Laser Sources
Single-mode lasers with stable coherence are commonly used, including diode lasers, fiber lasers, solid-state lasers. Wavelength selection depends on surface properties, penetration depth, and safety considerations.
Imaging Optics and Cameras
Standard imaging lenses are often sufficient, although telecentric optics may be used for improved geometric stability. High-frame-rate CMOS cameras are preferred for dynamic measurements, while scientific-grade sensors improve sensitivity for low-light conditions.
Computational Processing
The real sophistication of speckle metrology lies in software. Algorithms handle correlation analysis, statistical modeling, noise rejection, displacement field reconstruction. Advances in GPU computing and machine learning are increasingly enabling real-time speckle analysis for inline inspection.
Comparison With Other Optical Metrology Techniques
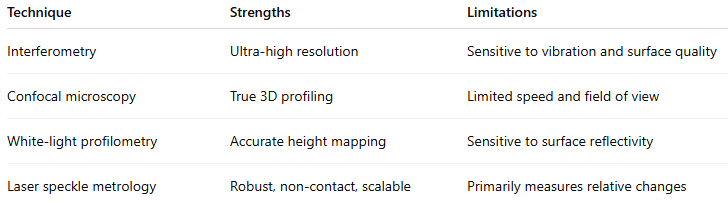
Laser speckle imaging does not replace traditional methods but complements them, particularly where robustness and coverage matter more than absolute nanometer accuracy.
Case Study of Laser Speckle Surface Metrology
Inline Surface Roughness Measurement Using Laser Speckle Imaging
Let’s consider a specific example to get a better sense of how speckle imaging works.
Application: Non-contact surface metrology
Industry: Precision metal manufacturing
Measurement target: Ground stainless steel surface finish
Roughness range: Ra ≈ 0.2–1.2 µm
The Measurement Challenge
A manufacturer of precision-ground stainless steel components needed a way to verify surface finish inline, directly on the production floor. Conventional stylus profilometers provided accurate Ra values, but they were slow, prone to tip wear, and unsuitable for continuous inspection. Optical interferometry offered high resolution but required vibration isolation and careful alignment, making it impractical in a factory environment.
The goal was a fast, non-contact, robust method capable of detecting subtle changes in surface roughness without slowing throughput.
Optical Setup
The inspection system used a simple laser speckle imaging configuration:
Illumination:
A 635 nm single-mode diode laser delivering ~10 mW of optical power. The beam was expanded to approximately 5 mm in diameter to ensure uniform illumination of the surface.Illumination geometry:
Near-normal incidence to simplify interpretation and reduce shadowing from directional surface features.Imaging:
A monochrome CMOS camera with 5 µm pixels captured the reflected speckle pattern through a standard imaging lens. The lens was selected so that the average speckle size covered roughly 2–3 pixels, ensuring proper spatial sampling.
This configuration minimized system complexity while maintaining sufficient sensitivity to surface-induced phase variations.
Measurement Principle
When coherent laser light reflects from a rough surface, microscopic height variations introduce random phase shifts. These phase differences interfere constructively and destructively at the camera, forming a granular intensity pattern known as laser speckle.
Rather than analyzing individual speckle grains, the system extracts statistical information from the image. Surface roughness alters the degree of phase randomness, which directly affects the contrast of the speckle pattern:
Smoother surfaces produce more correlated phases and higher speckle contrast
Rougher surfaces randomize the phase more strongly, reducing speckle contrast
This makes speckle contrast a useful proxy for surface roughness once calibrated.
Speckle Contrast Calculation
Each captured image is processed by selecting a region of interest (ROI), typically 256 × 256 pixels. The speckle contrast K is calculated as:

where σ is the standard deviation of pixel intensities and ⟨I⟩ is the mean intensity within the ROI.
Example Measurement
From a single ROI:
Mean intensity: 120 (camera units)
Standard deviation: 36
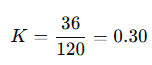
This calculation requires only basic image statistics and can be performed in real time.
Calibration to Surface Roughness
Speckle contrast does not yield absolute roughness values on its own. A calibration step is required using reference samples measured by a stylus profilometer.
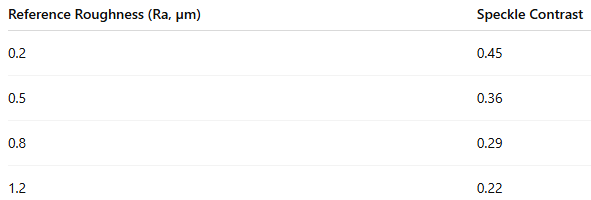
An exponential relationship provides a good empirical fit:
![]()
Once understanding the system constants K0 and α, measured speckle contrast values can be converted directly into estimated roughness. For the earlier example (K=0.30), the calibrated model yielded: This estimation was achieved in milliseconds, without physical contact.
Full-Field Surface Mapping
Beyond single-value measurements, the speckle image can be processed using a sliding window approach, computing local speckle contrast across the field of view. The result is a 2D roughness map that highlights spatial variations caused by tool wear, localized defects, or inconsistent grinding. This capability transforms laser speckle analysis from a point measurement into a full-field inspection technique.
Practical Considerations
Several practical factors influence measurement reliability:
Mechanical stability: Even small vibrations alter speckle statistics. Short exposure times and rigid mounting improve repeatability.
Speckle size: Must be matched to camera pixel size to avoid under- or over-sampling.
Surface anisotropy: Strongly directional textures may benefit from multi-angle illumination.
Laser coherence: Excessively high coherence can amplify noise; slight prove beneficial.
Despite these considerations, the system remains significantly simpler than interferometric alternatives.
Why It Matters
This case study illustrates how laser speckle, often treated as an optical artifact, can become a quantitative metrology signal when properly controlled and calibrated. For industrial environments, laser speckle imaging offers a compelling balance of speed, sensitivity, and robustness, particularly for inline surface inspection where traditional techniques struggle.
Industrial and Scientific Applications of Laser Speckle Surface Metrology
Laser speckle surface metrology is used across diverse fields, such as additive manufacturing process monitoring, composite material testing, optical component inspection, semiconductor packaging analysis, biomechanics and soft tissue mechanics, cultural heritage conservation. Its ability to operate without surface preparation or environmental isolation makes it attractive for both laboratory research and factory-floor deployment.
Challenges and Practical Considerations
Despite its strengths, speckle-based metrology requires careful system design. Sensitivity to illumination stability, camera noise, and environmental drift must be managed. Calibration procedures are often application-specific, and interpreting speckle statistics requires an understanding of both optics and material behavior.
Ongoing research is addressing these challenges through improved modeling, hybrid measurement approaches, and AI-assisted interpretation.
Conclusion
Laser speckle imaging has evolved from a perceived optical nuisance into a versatile metrology tool capable of revealing surface roughness, deformation, vibration, and dynamic behavior. Its non-contact nature, robustness, and scalability make it uniquely suited for real-world measurement challenges where conventional optical techniques fall short.
As computational power and imaging hardware continue to advance, laser speckle surface metrology is poised to play an increasingly important role in industrial inspection, materials science, and precision engineering.