PSI-Plot Scientific Spreadsheet And Technical Plotting
Description
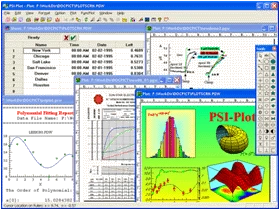
PSI-Plot brings new ease and flexibility to technical plotting and data analysis. It has a powerful scientific spreadsheet for data analysis; and an object-oriented on screen graphics editor that makes it easy to design and modify graphs. The powerful features combine with the intuitive and user friendly interface have made PSI-Plot one of the most popular data analysis and graphing software. With the newest version 10.5, PSI-Plot is definitely the most advanced yet easy-to use numerical tool for today's scientists and engineers.
PSI-Plot Scientific Spreadsheet And Technical Plotting
Applications
<align="left">powerful scientific spreadsheet</align="left">
data import from Excel, ASCII, CSV, Access, DBase, etc.
easy to learn, easy to use with step-by-step guided tutorial lessons
a wide range of numerical techniques
data interpolation and curve fitting
experimental model builder
multiple and stepwise regression
logistic regression
descriptive statistics, t-test, F-test
algebraic equation solver
differential equation solver
difference equation solver
matrix and eigen system
FFT and digital signal processing
special coordinate systems: polar, Smith, ternary, Nichols,...
spectacular 2D and 3D graphics
powerful graphics editing tool
embedding graphs in MS Word and PowerPoint
export graph to PDF, PostScript, EPS, JPG, GIF, BMP, WMF, EMF, PNG, and TIF.
superior publication quality output
For pricing, technical or any other questions please contact the supplier
- No registration required
- No markups, no fees
- Direct contact with supplier
-
Ships from:
-
Sold by:
-
On FindLight:
External Vendor

Claim Poly Software International Page to edit and add data
Frequently Asked Questions
Yes, PSI-Plot is easy to learn and use with step-by-step guided tutorial lessons. Its intuitive and user-friendly interface has made it one of the most popular data analysis and graphing software.
PSI-Plot has a wide range of applications, including data import from Excel, ASCII, CSV, Access, DBase, etc., data interpolation and curve fitting, experimental model builder, multiple and stepwise regression, logistic regression, descriptive statistics, t-test, F-test, algebraic equation solver, differential equation solver, difference equation solver, matrix and eigen system, FFT and digital signal processing, and special coordinate systems like polar, Smith, ternary, Nichols, etc.
PSI-Plot is a software that brings ease and flexibility to technical plotting and data analysis. It has a powerful scientific spreadsheet for data analysis and an object-oriented on-screen graphics editor that makes it easy to design and modify graphs.
The newest version of PSI-Plot is version 10.5, which is the most advanced yet easy-to-use numerical tool for today's scientists and engineers.
PSI-Plot offers spectacular 2D and 3D graphics and a powerful graphics editing tool. It also allows embedding graphs in MS Word and PowerPoint and exporting graphs to PDF, PostScript, EPS, JPG, GIF, BMP, WMF, EMF, PNG, and TIF.